We all know that 2023 was a year of widespread layoffs, but looking at the data reveals a harsh truth: not everyone was impacted equally. Here are the trends that we noticed when reviewing the 2023 layoff data reported by 40 state governments.
As a reminder of where this data comes from: The WARN Act of 1988 requires employers to report layoffs of a certain size to state government officials at least 60 days in advance of the layoff. States then report this data through various means, and we at WARNTracker aggregate this data for most of the states (40 out of 50). In short, WARNTracker’s dataset does not cover ALL US Layoffs but is one of the most representative datasets one can get.
So, what does the data show?
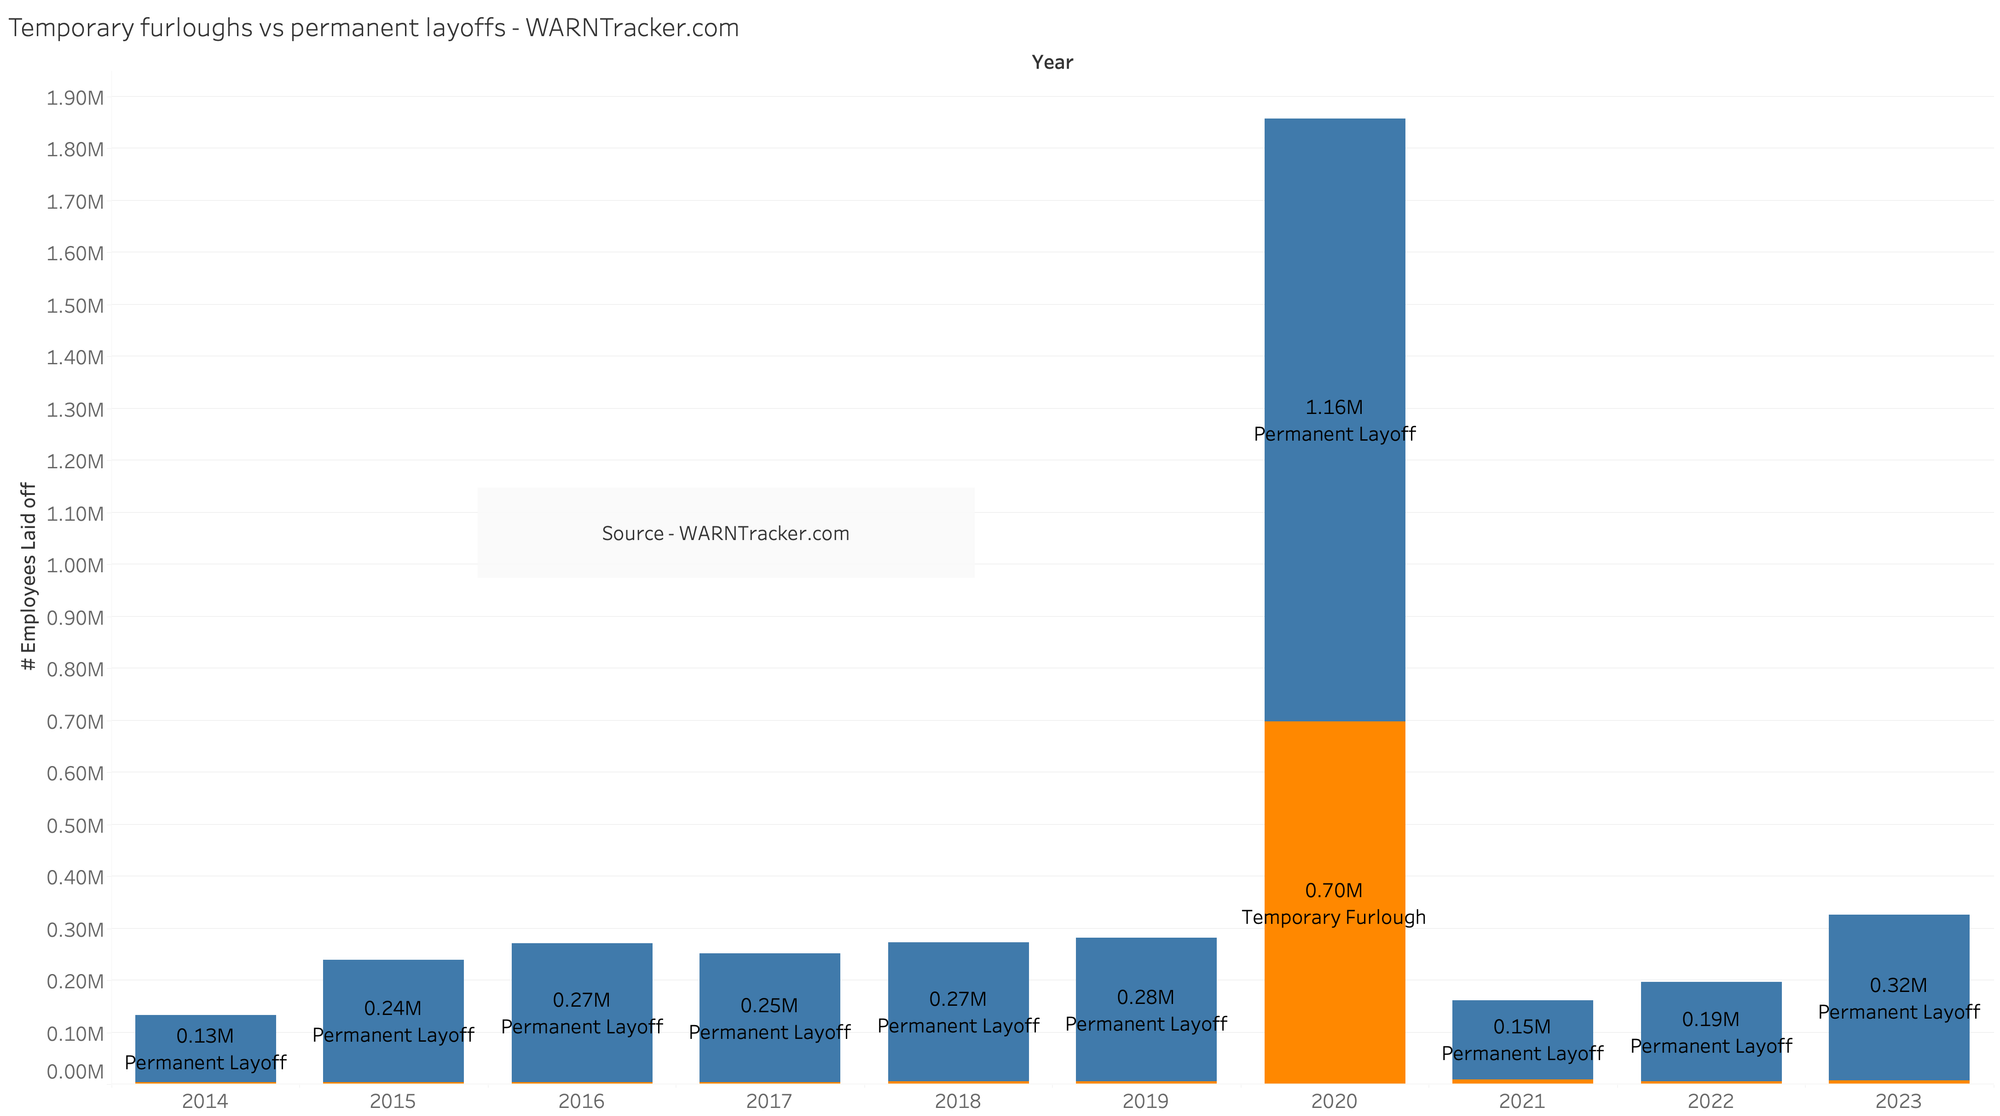
Layoffs picked up notably in 2023, but the 2023 numbers are still dwarfed by the layoff wave of 2020.

2020 layoffs were still more than 3.5 times the magnitude of 2023 layoffs, and nearly 8x the magnitude of 2021.
This doesn’t even include temporary furloughs. Including furloughs adds an additional 700,000 to the 2020 numbers.
Public-traded vs privately held companies
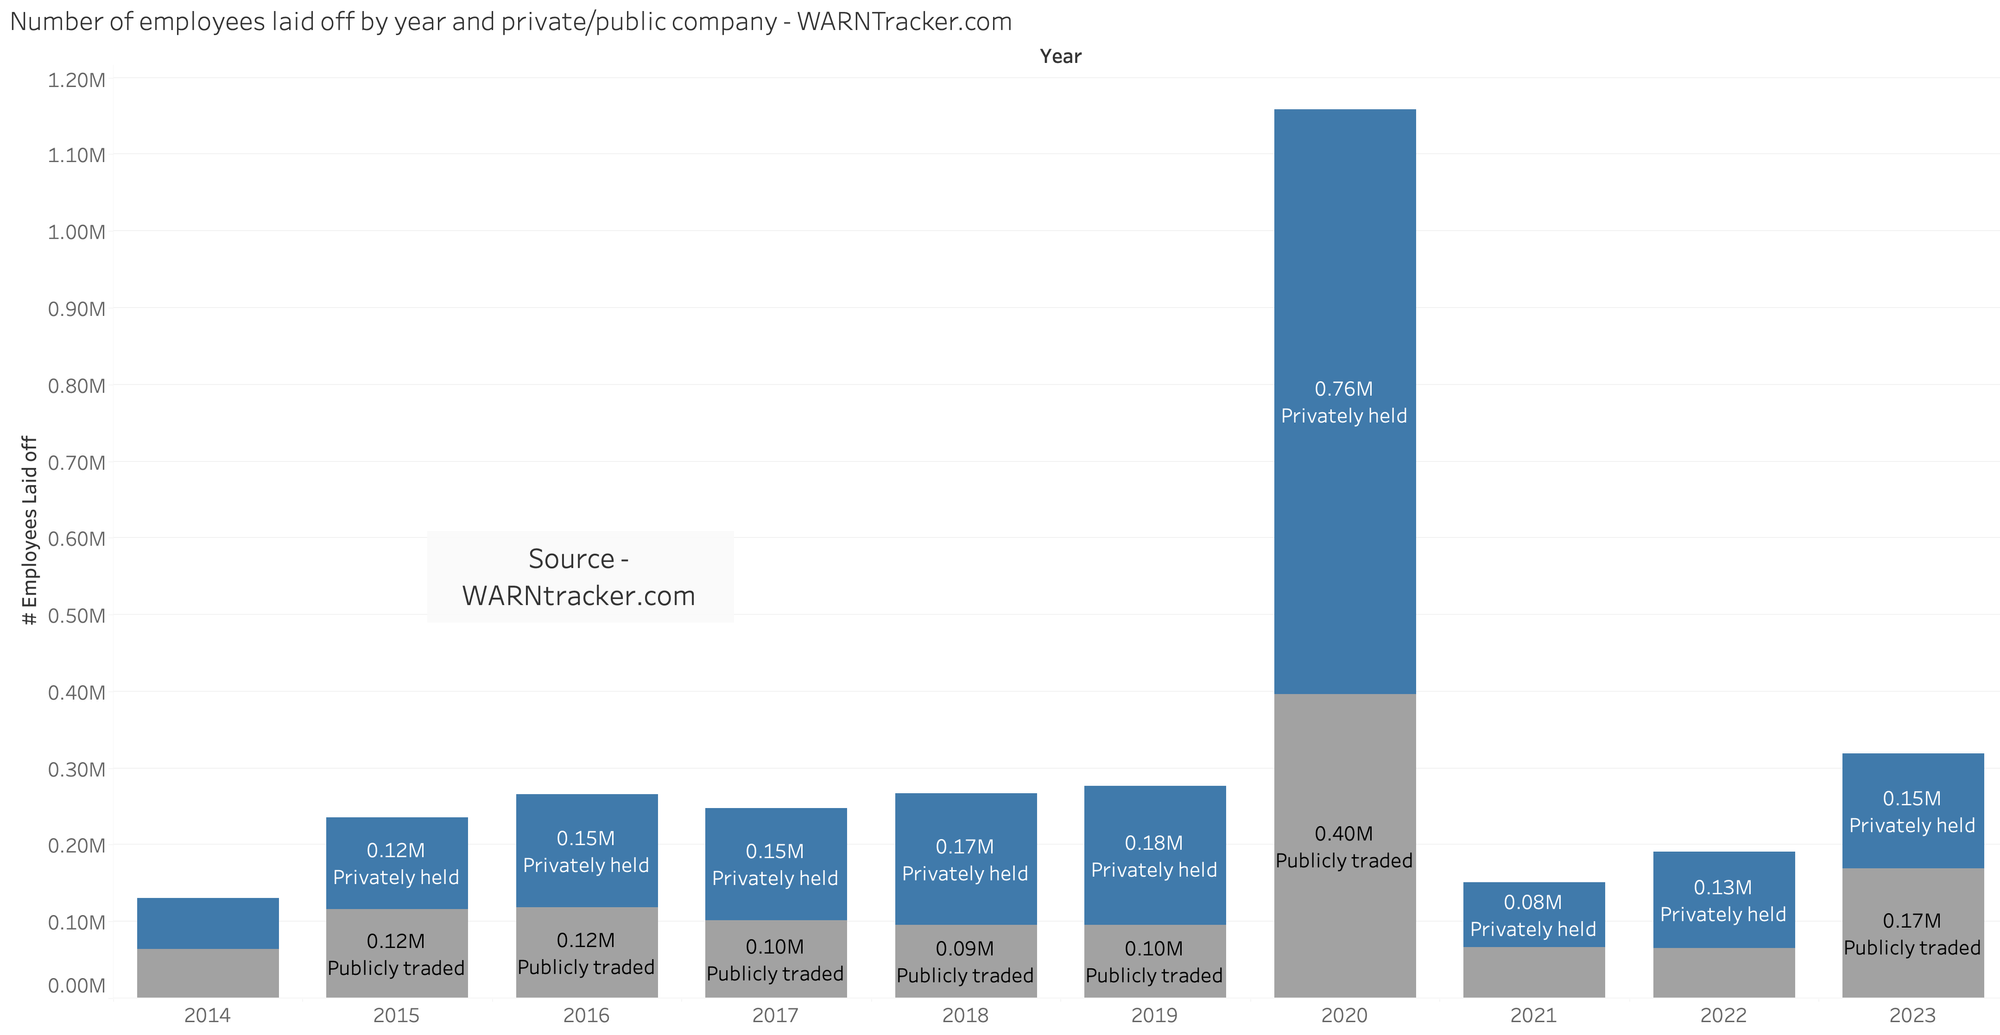
Unsurprisingly, 2020 layoffs impacted smaller, private businesses much more than larger, publicly traded companies. We see that in 2020, approximately two thirds of layoffs were from private companies. Contrast that with 2023, when only 47% of layoffs were reported from private companies.
Removing the 2020 outlier
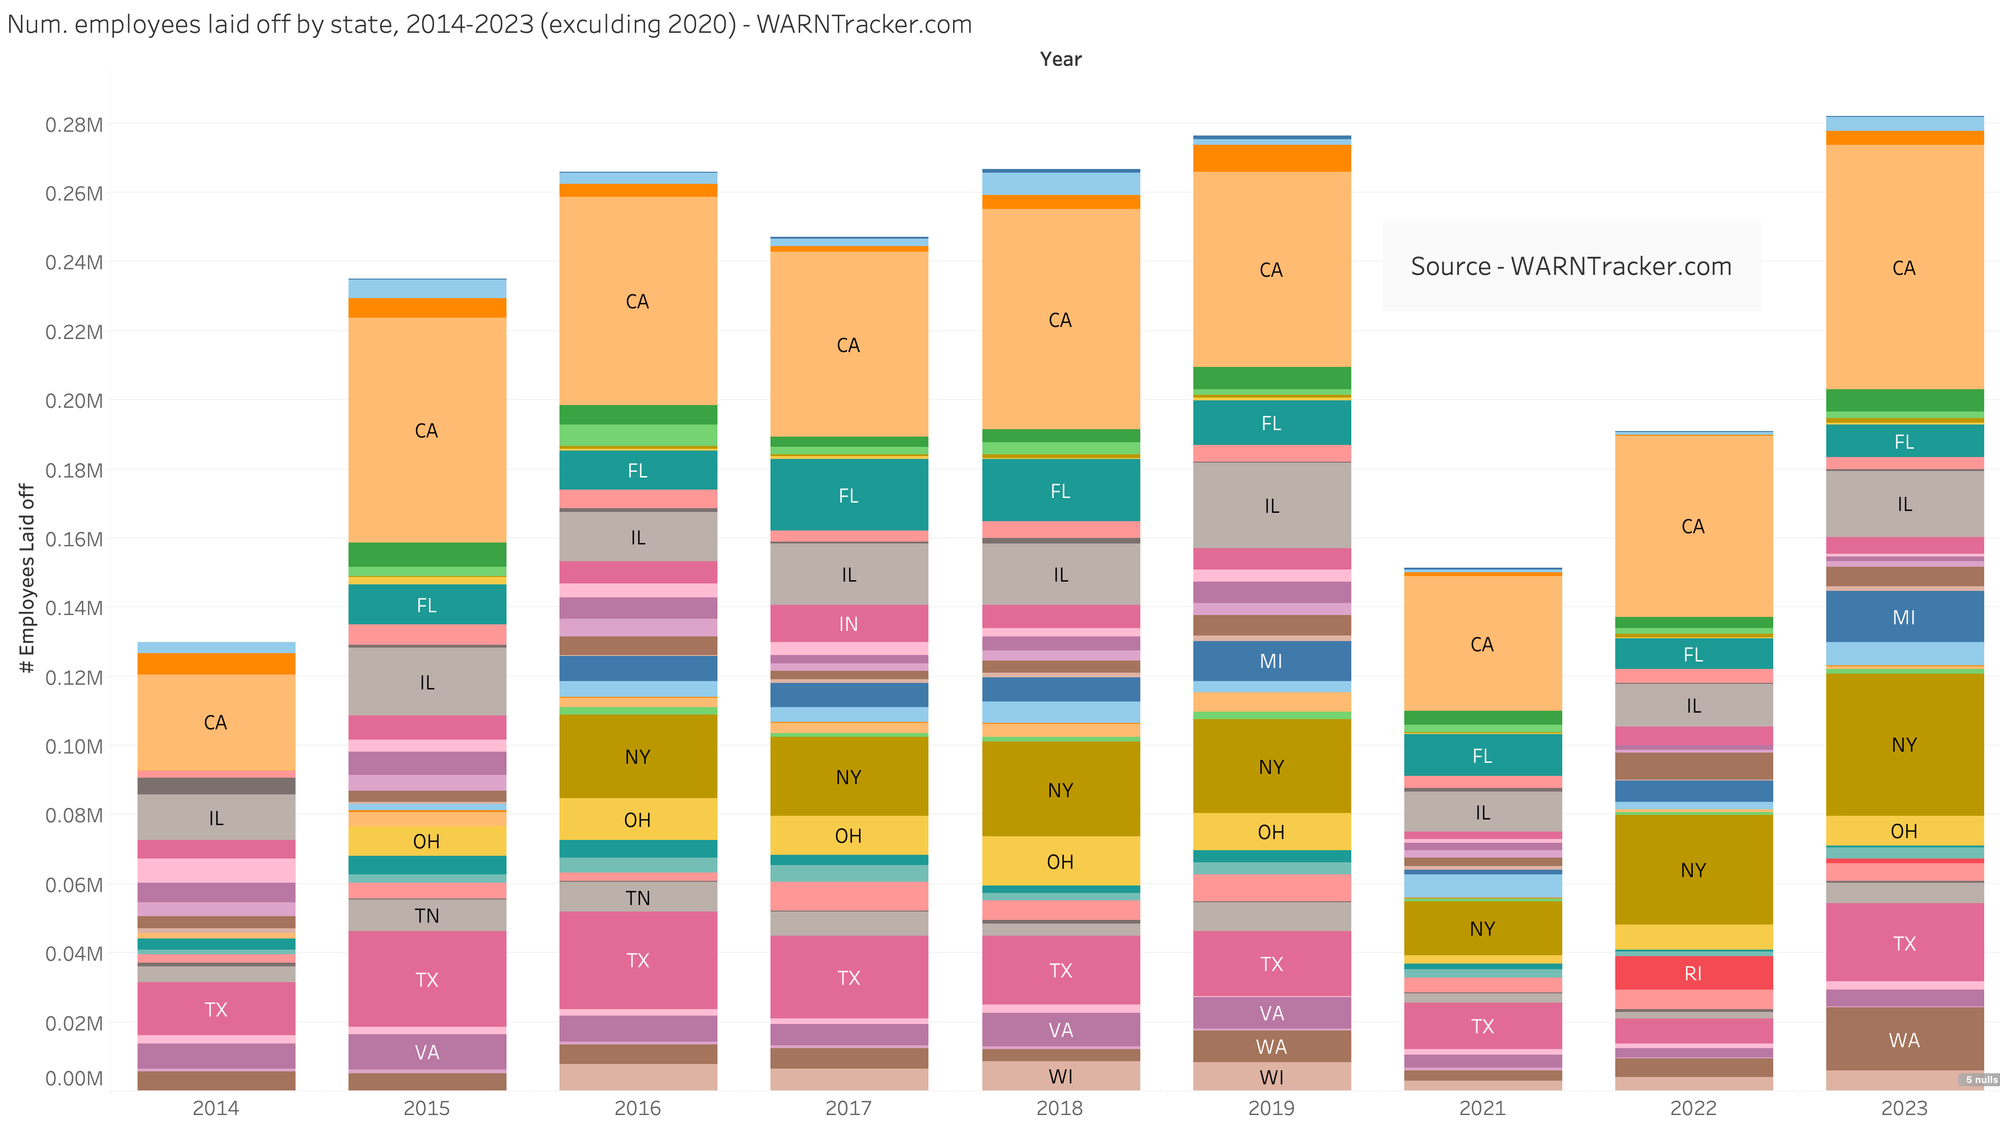
Given that 2020 was a clear outlier, how does 2023 compare to other (more “normal”) years?
Excluding 2020, we see that 2023 was the highest year for layoffs in the last decade, and 14% higher than the 2nd highest layoff year in the last decade (280,000 in 2019, vs 320,000 in 2023)
.png?table=block&id=9bb5dad6-15bc-40a6-90c3-8ea51c552ecc&cache=v2)
Quarterly view
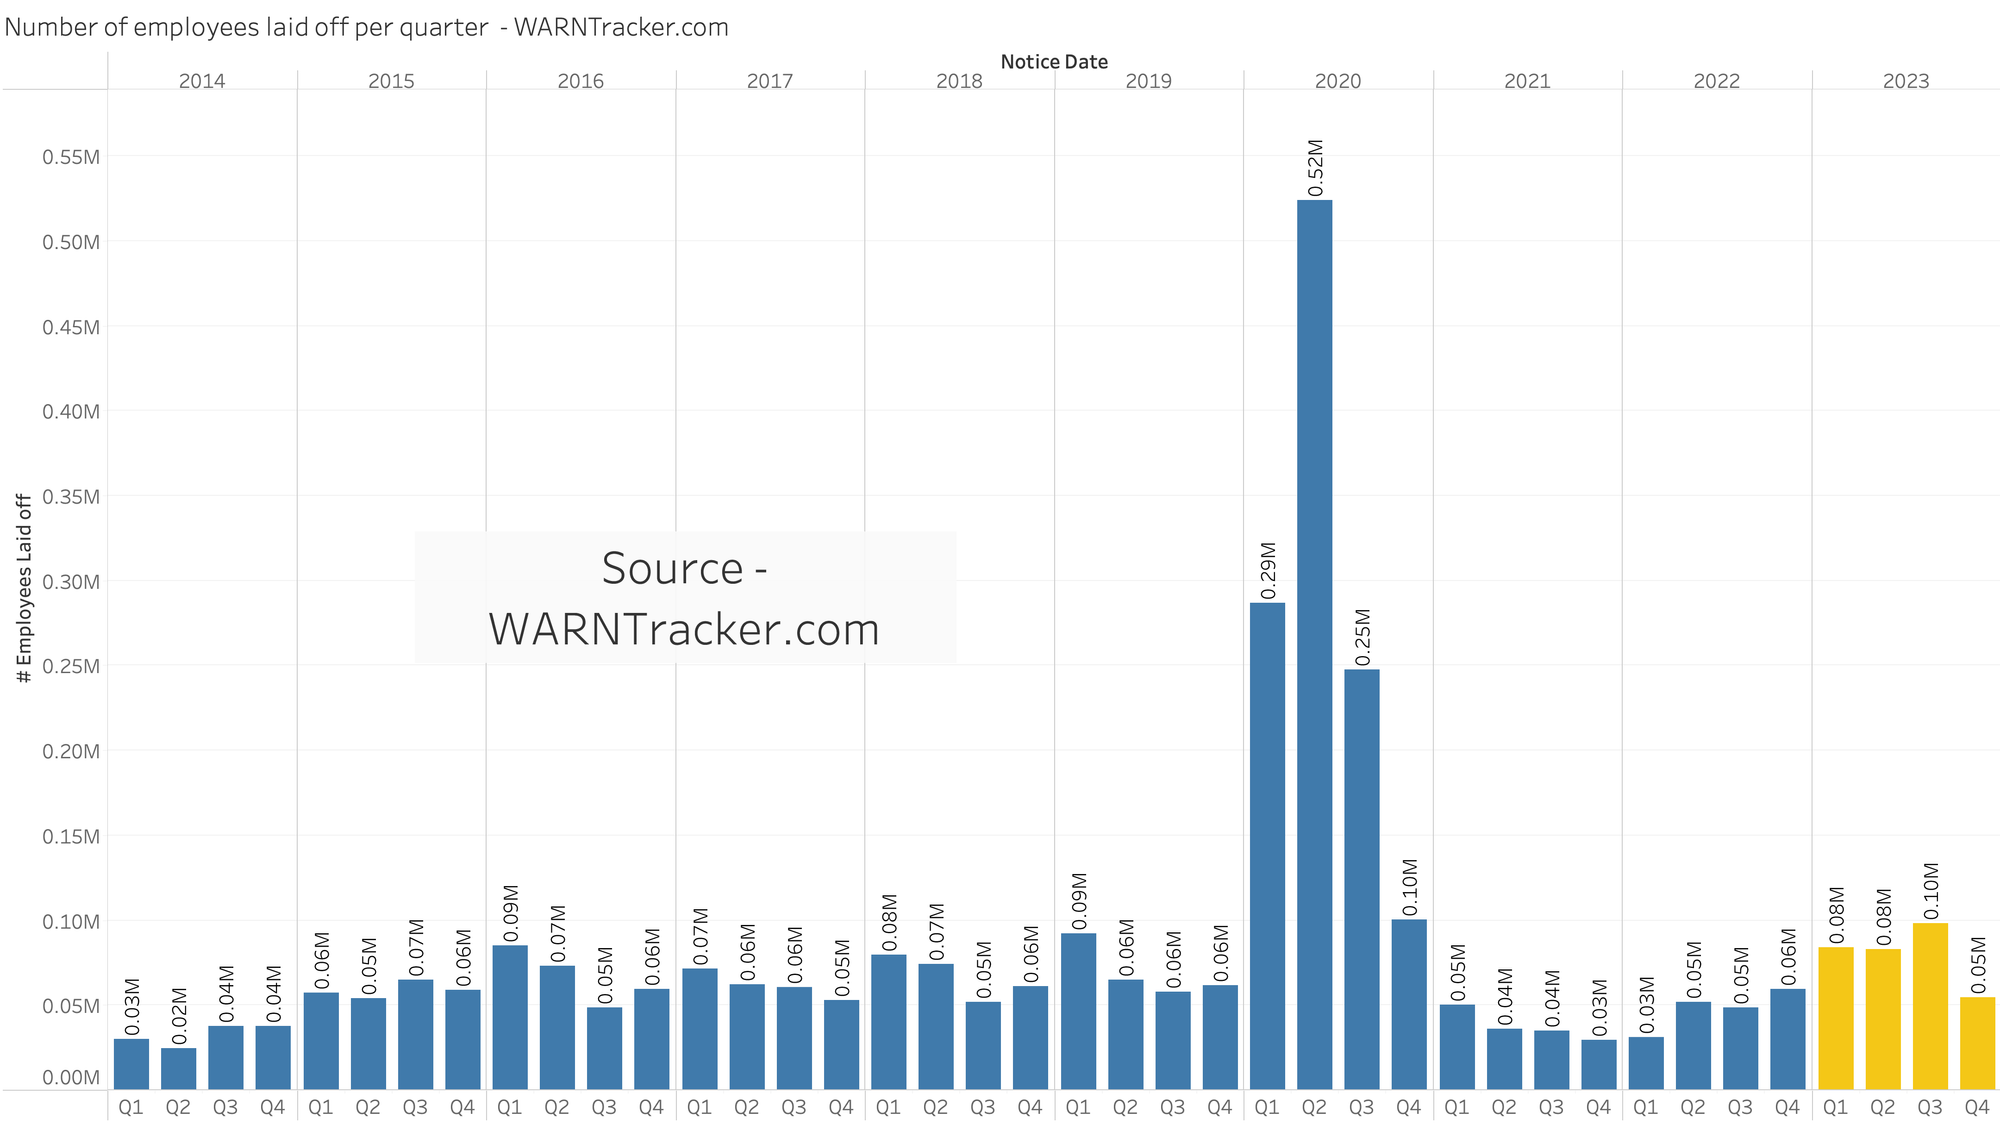
When we break down layoffs quarterly- we see that there was a steady increase in layoffs starting in Q1 2022, but things dipped in Q4 of 2023.
Variance per state is very high (total and per capita)
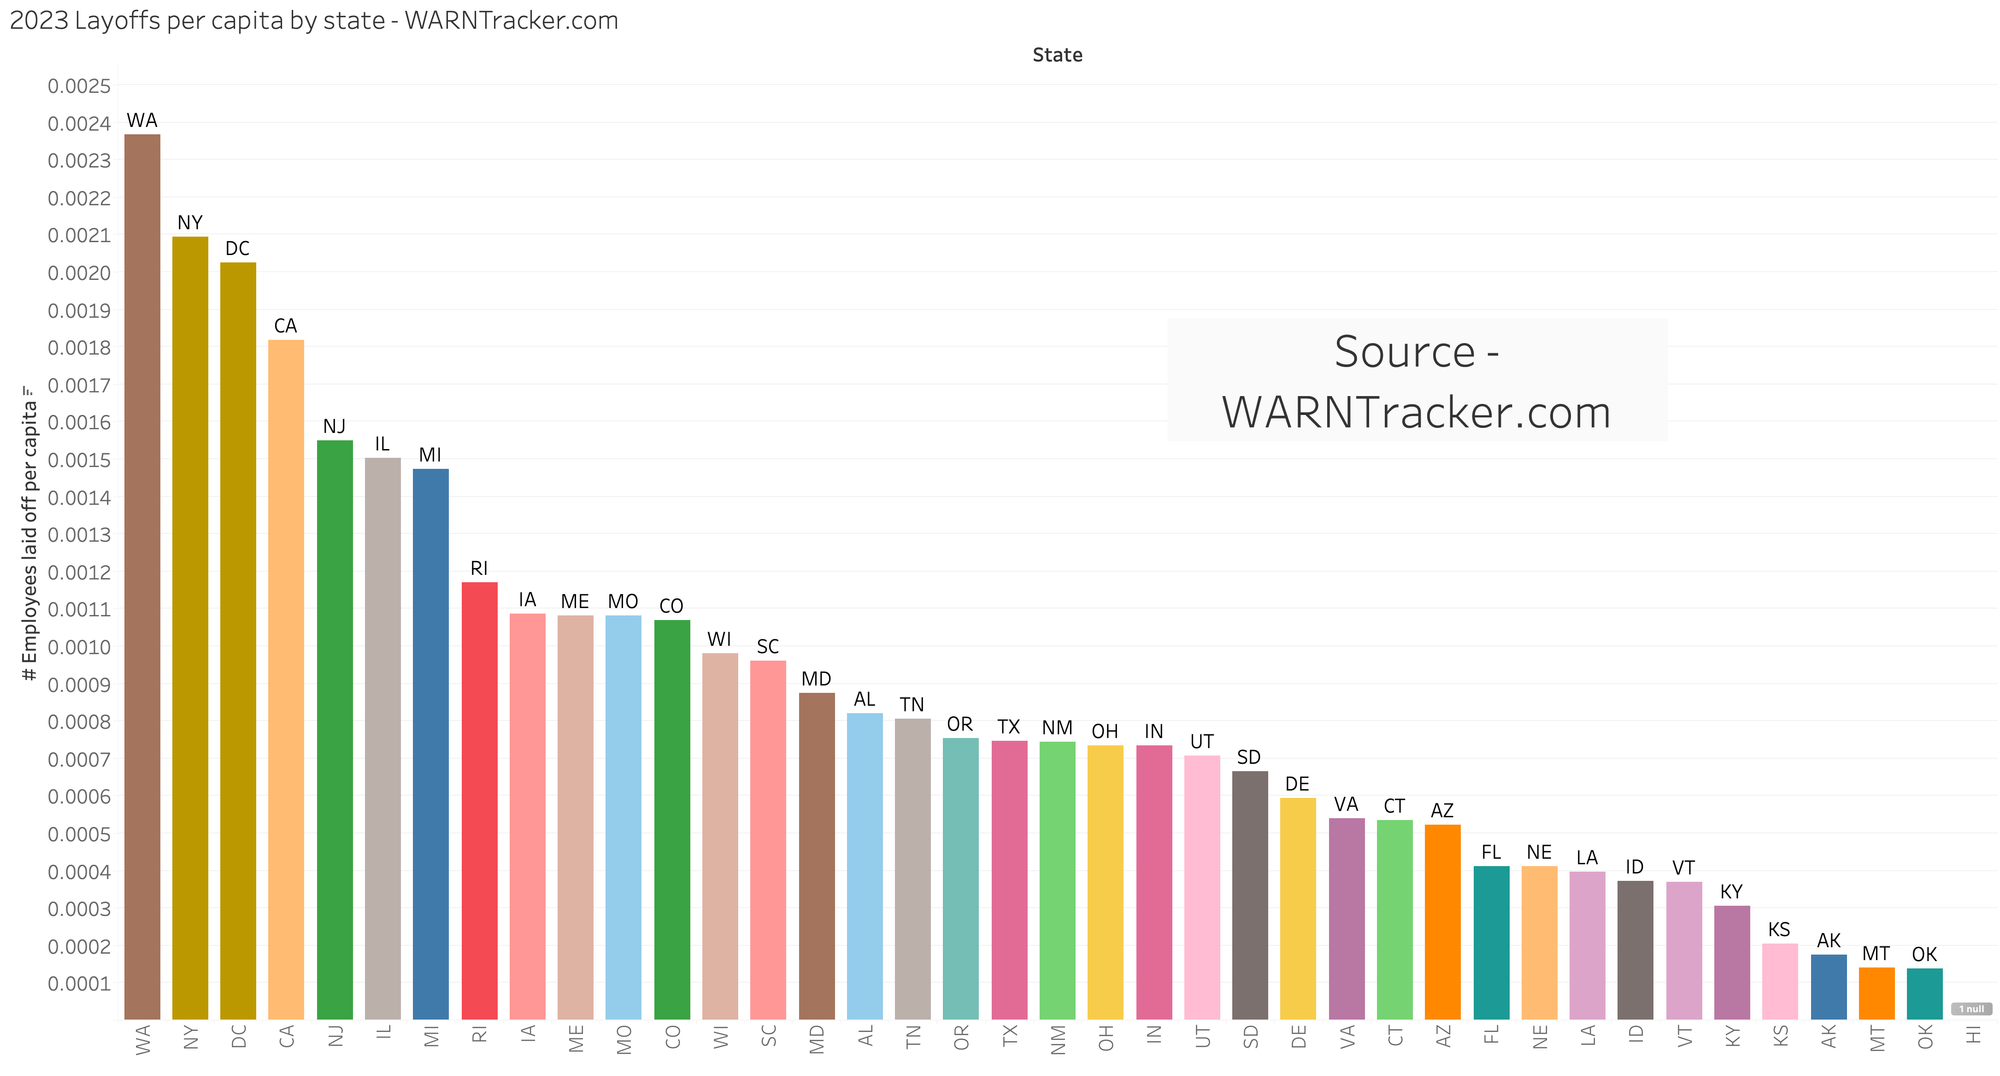
Here, we see a stark contrast. 2.3 out of every thousand Washingtonians, while only 0.1 out of every thousand Oklahomans were laid off, based on 2023 WARN notices.
This aligns with the anecdotal sentiment that tech was hit particularly hard in 2023. Many of the states with the highest rate of layoffs per capita are also the most tech-heavy states.
Each year, the most populous states (CA, NY, TX) typically dominate layoffs, unsurprisingly.
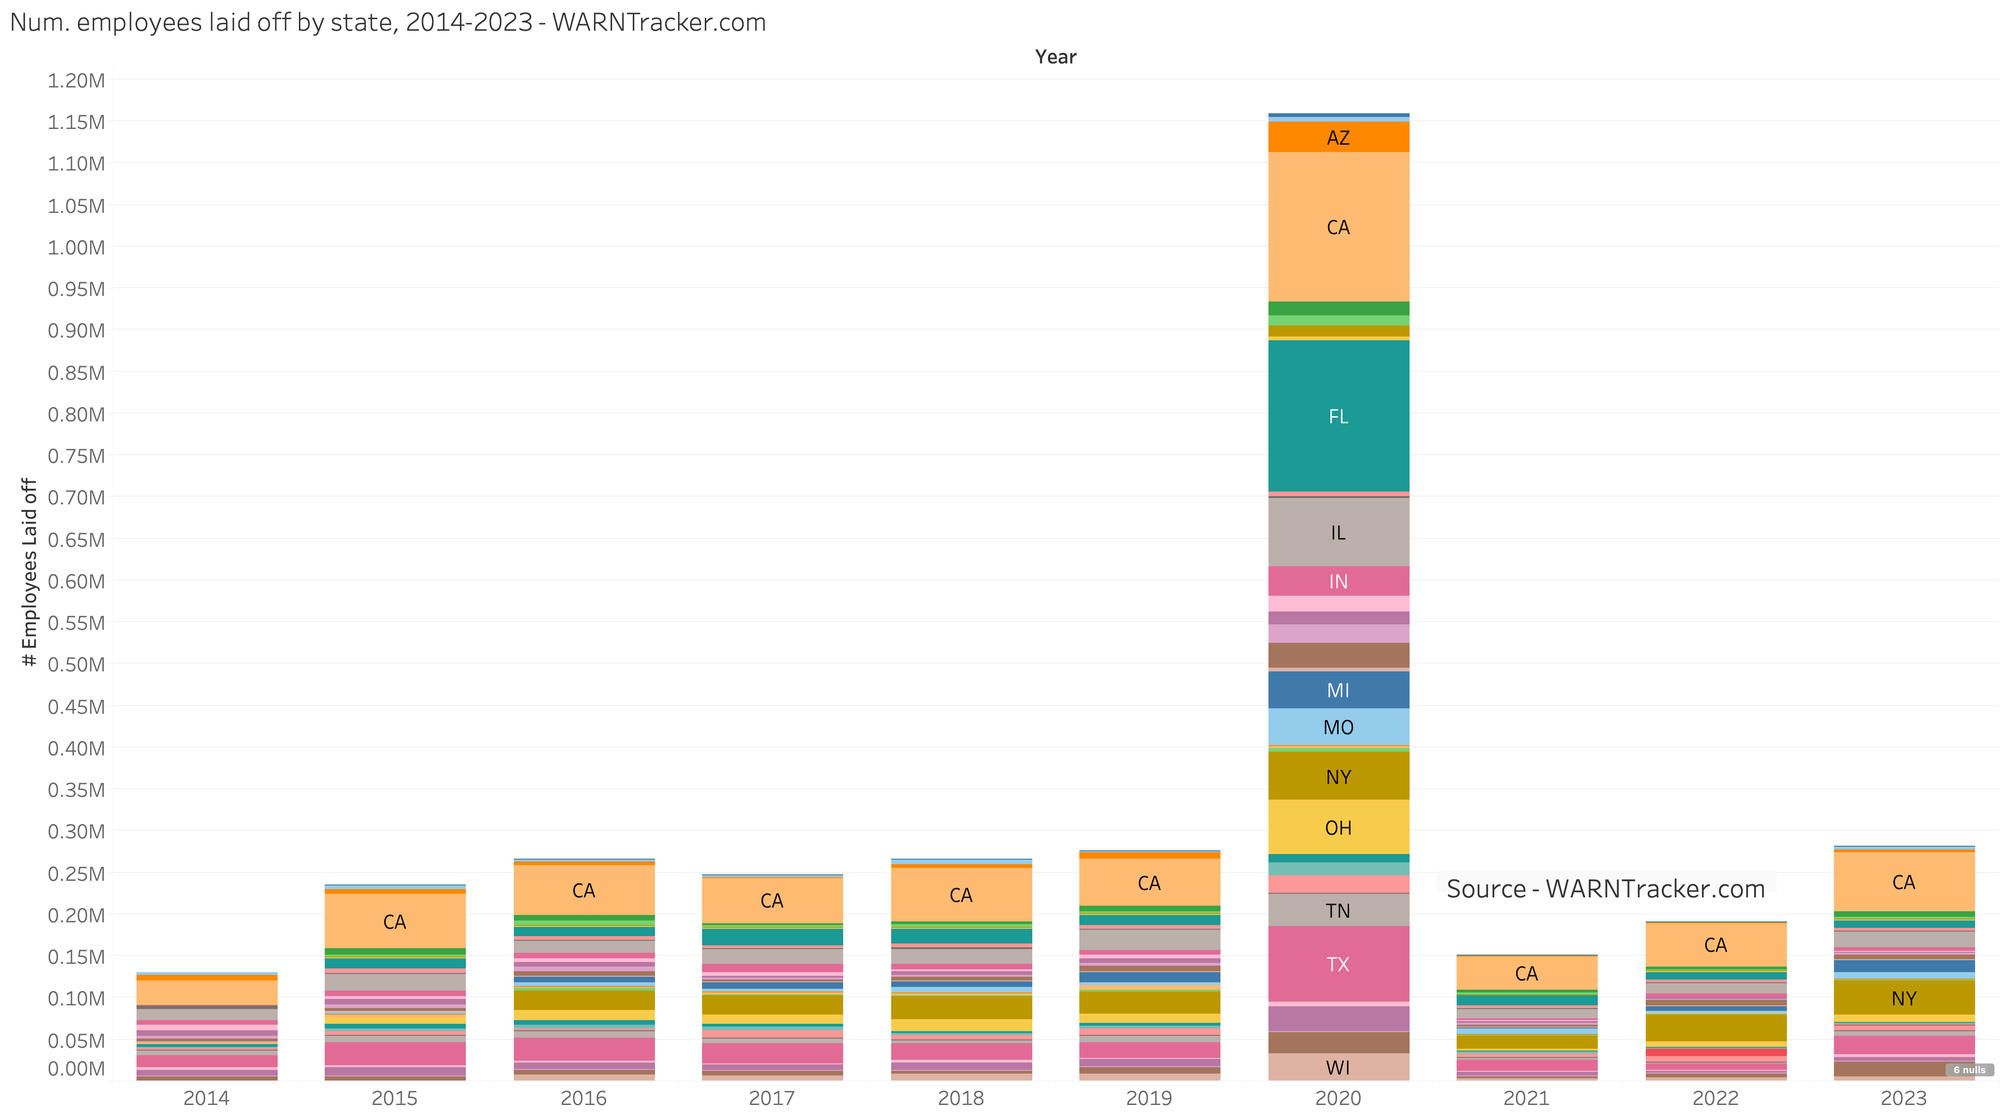
But if we look closely, we will see some surprising trends. For example, notice how large Rhode Island appears in 2022 relative to other years.
Caveats
- Note that in 2023, United Airlines did massive nationwide layoffs that were all associated with New Jersey, we hid that from our data for this analysis
- Also excluded: Yellow corporation from Colorado which was a 22,000 layoff in one event. That number is incorrect since it was distributed over many states (but the CO government reported it as one event under CO))
- Some of the states showing the highest layoffs per capita, also have their own “Mini-WARN” acts, which impose stricter requirements on layoff reporting, This may partially account for the large difference.
Contact us
If you’d like to interact with the data, check out our published interactive workbook below and our granular data tables, charts, and maps on the front page here.
If you’d like to purchase the underlying data from this report, see our various self-serve data products here. If you need more help, email us at [email protected].
Check out our blog with more layoff analysis here: https://www.warntracker.com/blog
Other interesting visualizations of this data
Here are some other interesting visualizations for this data we thought you as the reader might find useful
We used pie charts to divide up the layoffs per state on stylized US Map.
Click the tabs above to navigate between each visualization.
Get the Data
Get access to full data set Purchase historical WARN layoff notice data Purchase data subscription for future WARN layoff notices Purchase company-specific job title breakdown data Request laid-off employee profilesCharts
Layoff charts by state and yearLayoff insights
By company & stateBy role & levelSoftware engineer payroll reductionsTech layoff chartsBlog
Guide to Navigating LayoffsGuide to the WARN ActList of Tech Alumni CommunitiesAll blog postsAbout
For employers - Need help hiring?For job seekersFAQContact usReport possible WARN Act violationJob boards
30,000+ Climate Tech Jobs10,000+ AI / Machine Learning Jobs600+ Telemedicine & Remote Physician JobsTools
EIN & Tax ID Search for US CompaniesPower Plant & Electricity Grid AnalyticsData Center TrackerLayoffs by company
Amazon layoffsAramark layoffsBed Bath & Beyond layoffsBoeing layoffsCinemark layoffsGenentech layoffsGeneral Electric layoffsGoogle layoffsHyatt layoffsIntel layoffsJohnson & Johnson layoffsMacy's layoffsMarriott International layoffsMeta/Facebook layoffsMicrosoft layoffsNestle layoffsNetflix layoffsPfizer layoffsSalesforce layoffsTesla layoffsThermo Fisher layoffsTwitter layoffsUnited Airlines layoffsWalmart layoffsOther companiesLayoffs by year
Layoffs in 2025Layoffs in 2024Layoffs in 2023Layoffs in 2022Layoffs in 2021Layoffs in 2020Layoffs in 2019Layoffs in 2018Layoffs in 2017Layoffs in 2016Layoffs in 2015Layoffs in 2014Layoffs in 2013Layoffs in 2012Layoffs in 2011Layoffs in 2010Layoffs in 2009Layoffs in 2008Layoffs in 2007Layoffs in 2006Layoffs in 2005Layoffs in 2004Layoffs in 2003Layoffs in 2002Layoffs in 2001Layoffs in 2000Layoffs in 1999Layoffs in 1998Layoffs in 1997Layoffs in 1996Layoffs in 1995Layoffs in 1994Layoffs in 1993Layoffs in 1992Layoffs in 1991Layoffs in 1990Layoffs in 1989Layoffs in 1988Layoffs by state
CaliforniaNew YorkAlaskaAlabamaArizonaColoradoConnecticutD.C.DelawareFloridaGeorgiaHawaiiIowaIdahoIllinoisIndianaKansasKentuckyLouisianaMassachusettsMarylandMaineMichiganMissouriMontanaNebraskaNew JerseyNew MexicoOhioOklahomaOregonPennsylvaniaRhode IslandSouth CarolinaSouth DakotaTennesseeTexasUtahVirginiaVermontWashingtonWisconsin
© 2025 WARNTracker. All rights reserved.
Some logos provided by Clearbit.Get the Data