Meta and Google layoffs: are they biased against ICs?
By Chris Talley, and Steven Zhang
March 21, 2023
The narrative from Meta has been that they are heavily focused on reducing middle management in an attempt to flatten the company structure. While we can’t speak to their future plans, this does not appear to have been a focus in their previous rounds of layoffs.
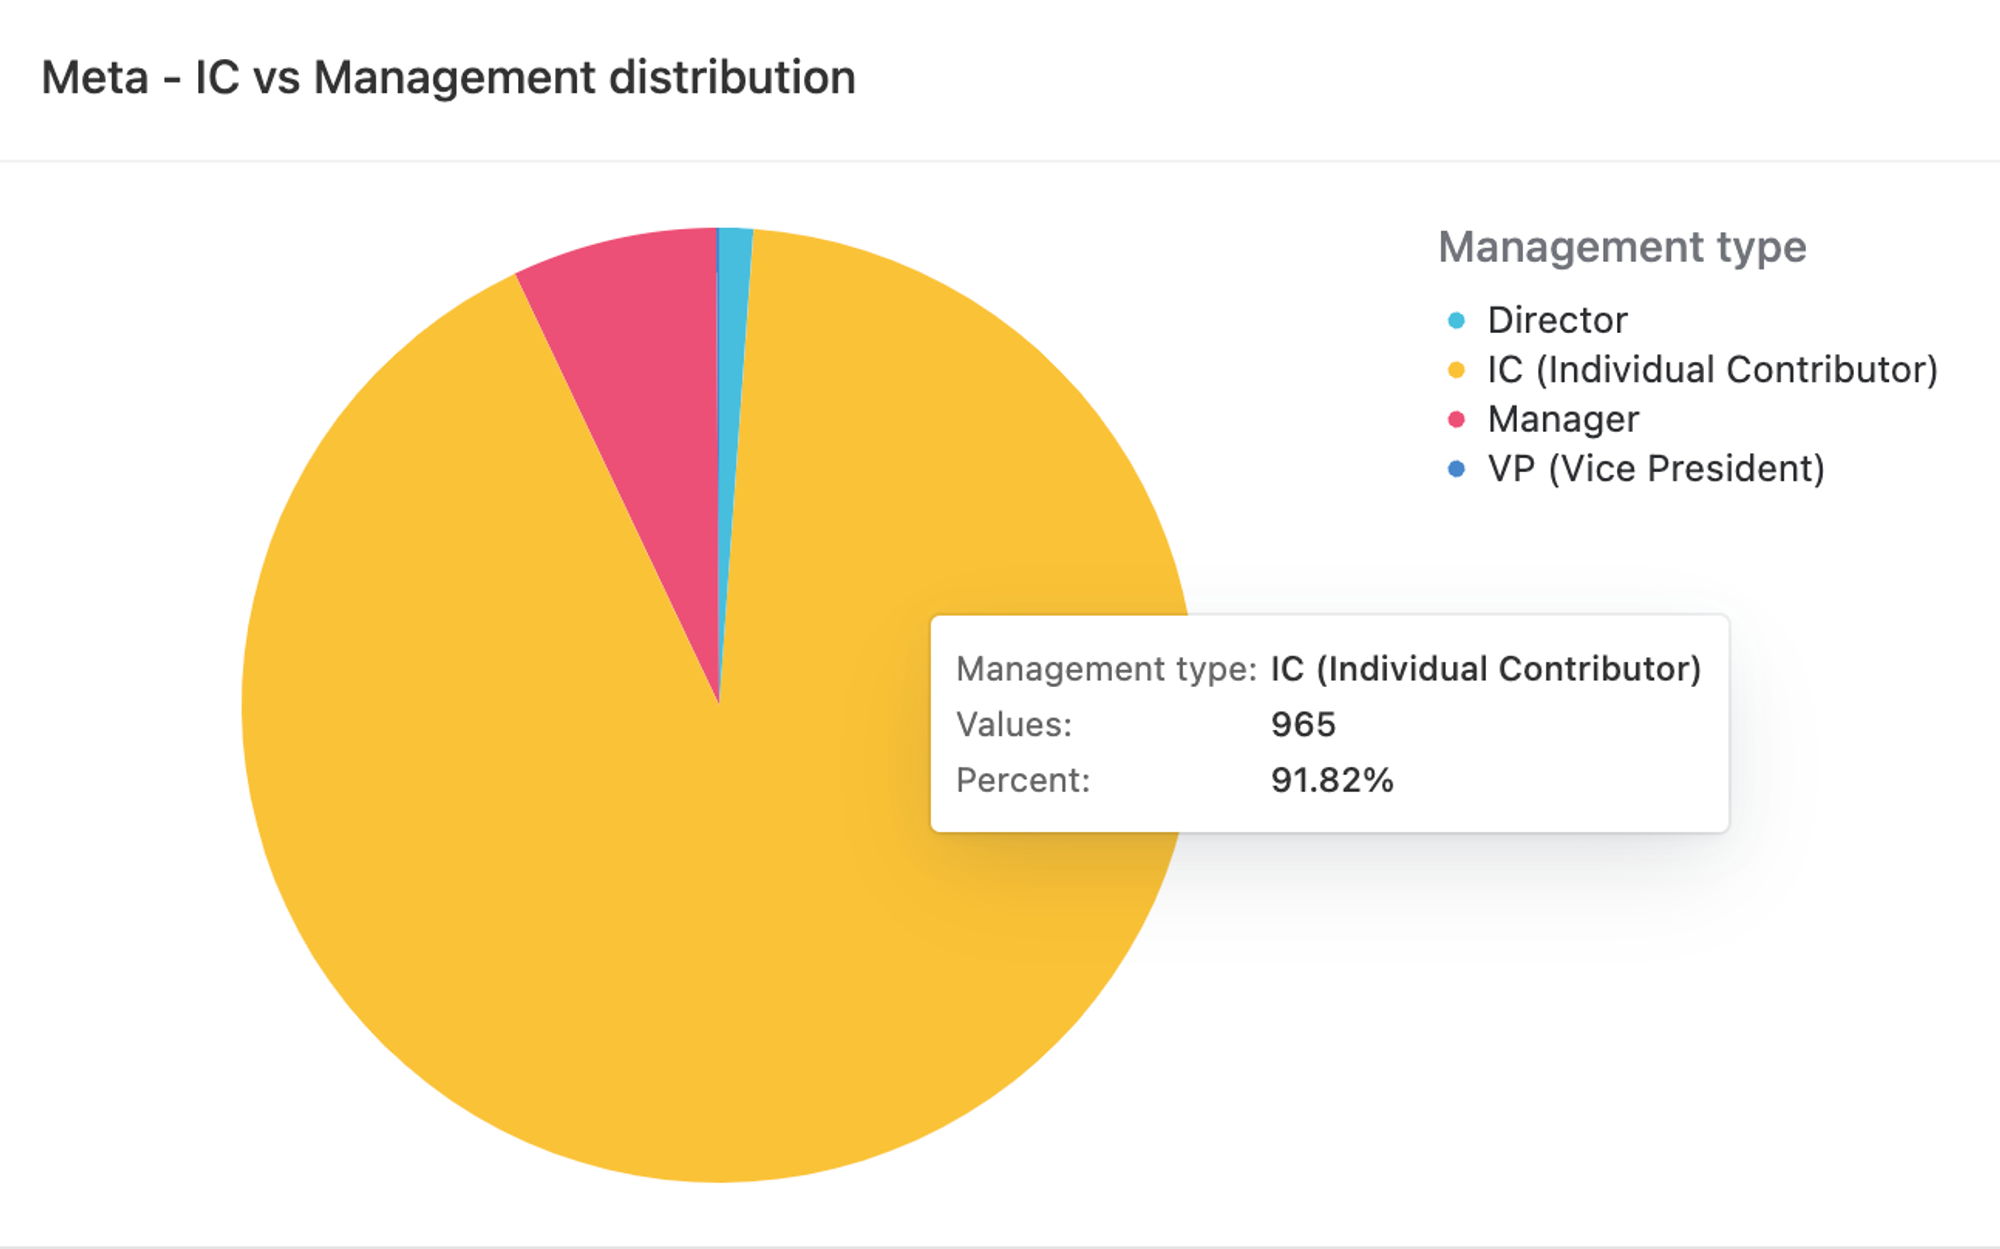
First, let’s take a look at Meta layoffs in engineering:

Individual contributor: 92%
Manager: ~7%
Director: ~1%
It is clear that the vast majority of affected employees, at least in engineering, were individual contributors.
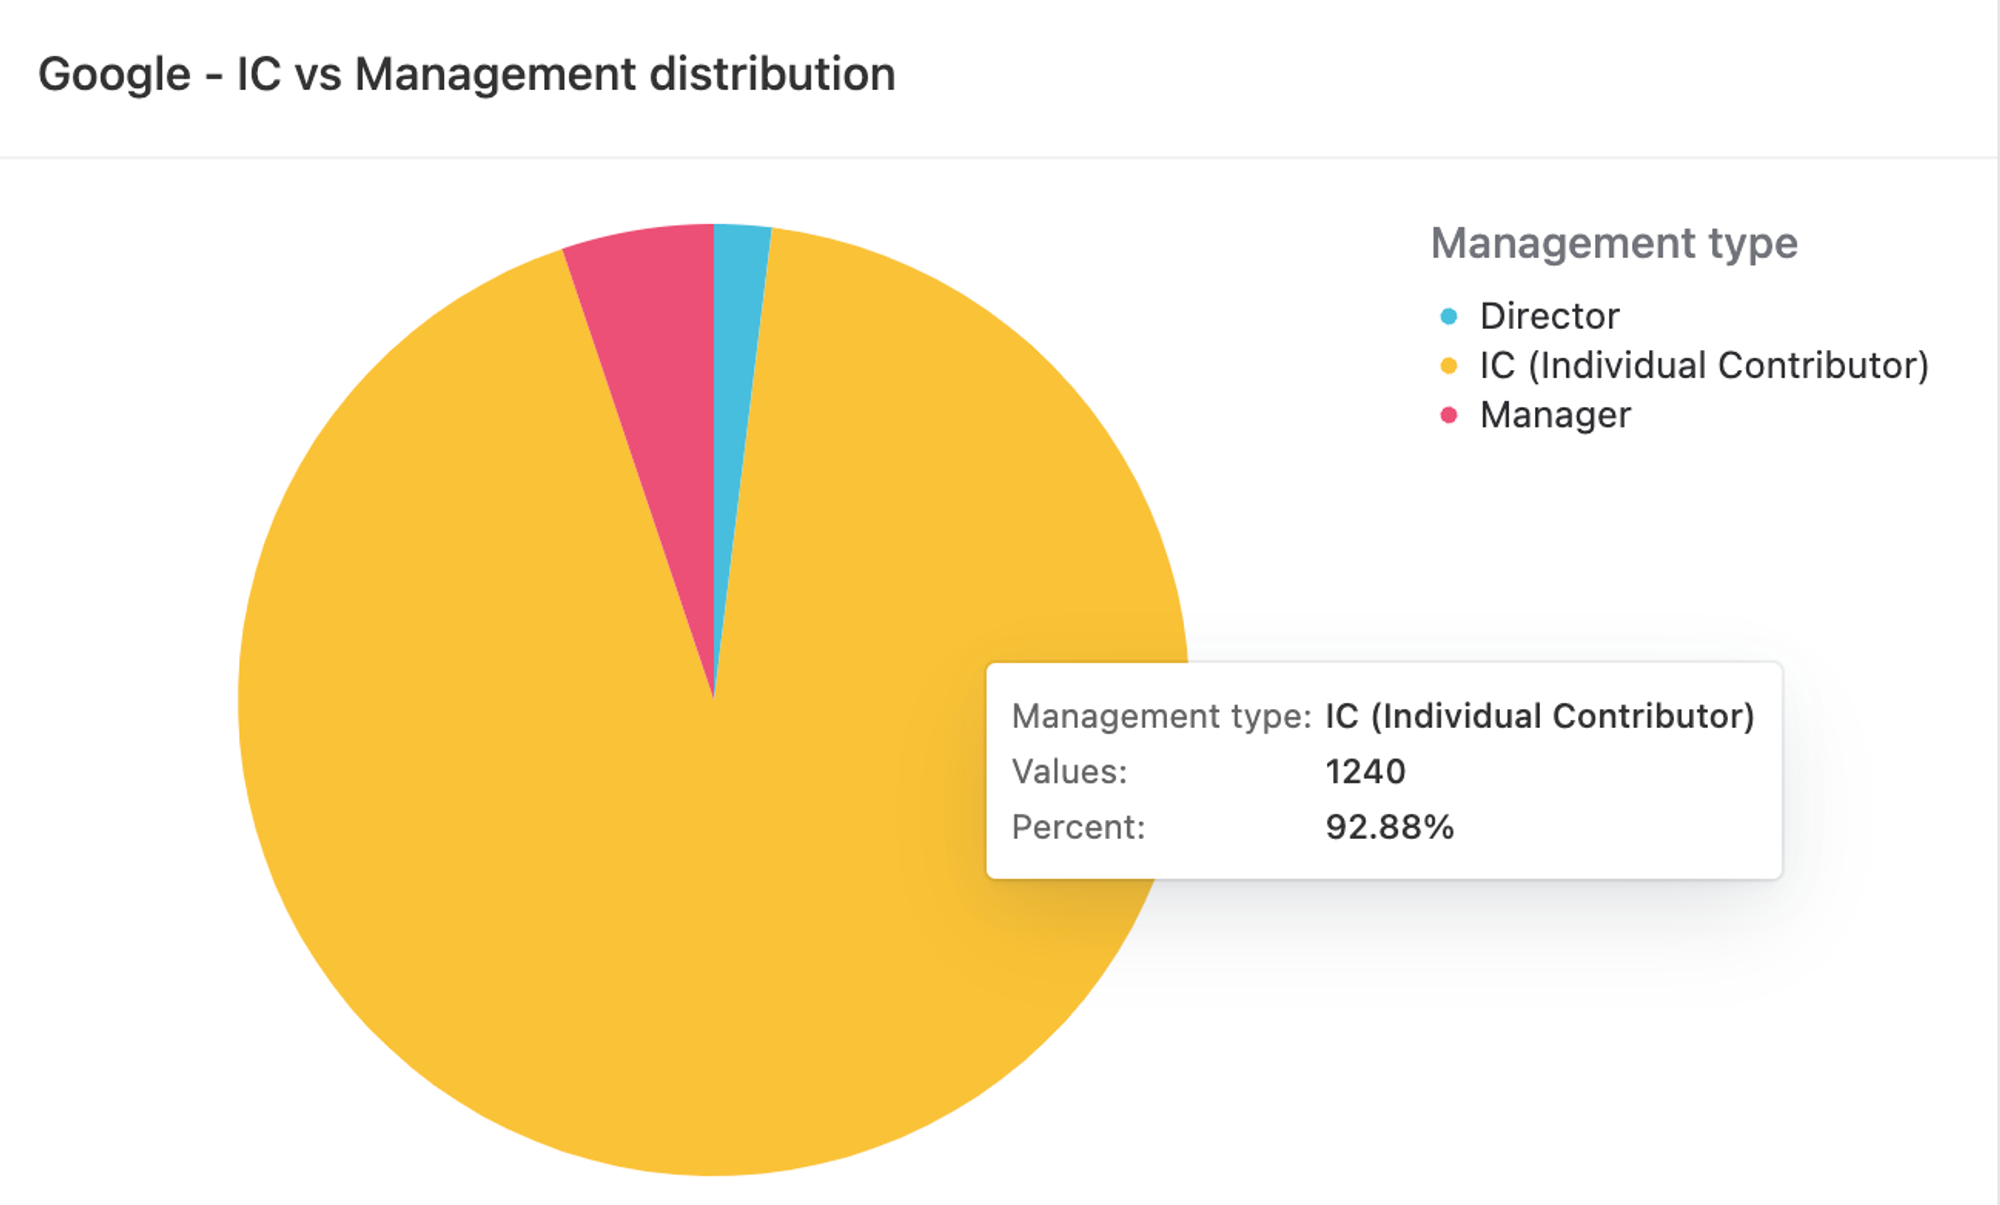
Let’s take a look at another household tech giant, Google:

Individual contributor: 93%
Manager: 5%
Director: 2%
So while Meta did lay off a larger percentage of middle managers than their counterpart (7% vs 5%, which reflects a 40% relative increase in management affected), the overall population of affected employees still appears to skew overwhelmingly towards individual contributors.
This is probably no shock for most people — managers are far less plentiful in the general population of employees at any company, so it is expected that any layoff would affect more individual contributors in absolute numbers. However, this data seems to indicate that individual contributors were more heavily affected than managers, even adjusting for the size differences in population. This analysis indicates that there were 18.6 individual contributors affected for every manager affected at Google, and 13.1 at Meta. Given that the average manager likely has far fewer than 18.6 or even 13.1 reports, it does not appear that these layoffs were effective at reducing middle management, and it looks like Google’s layoffs overwhelmingly affected ICs over managers.
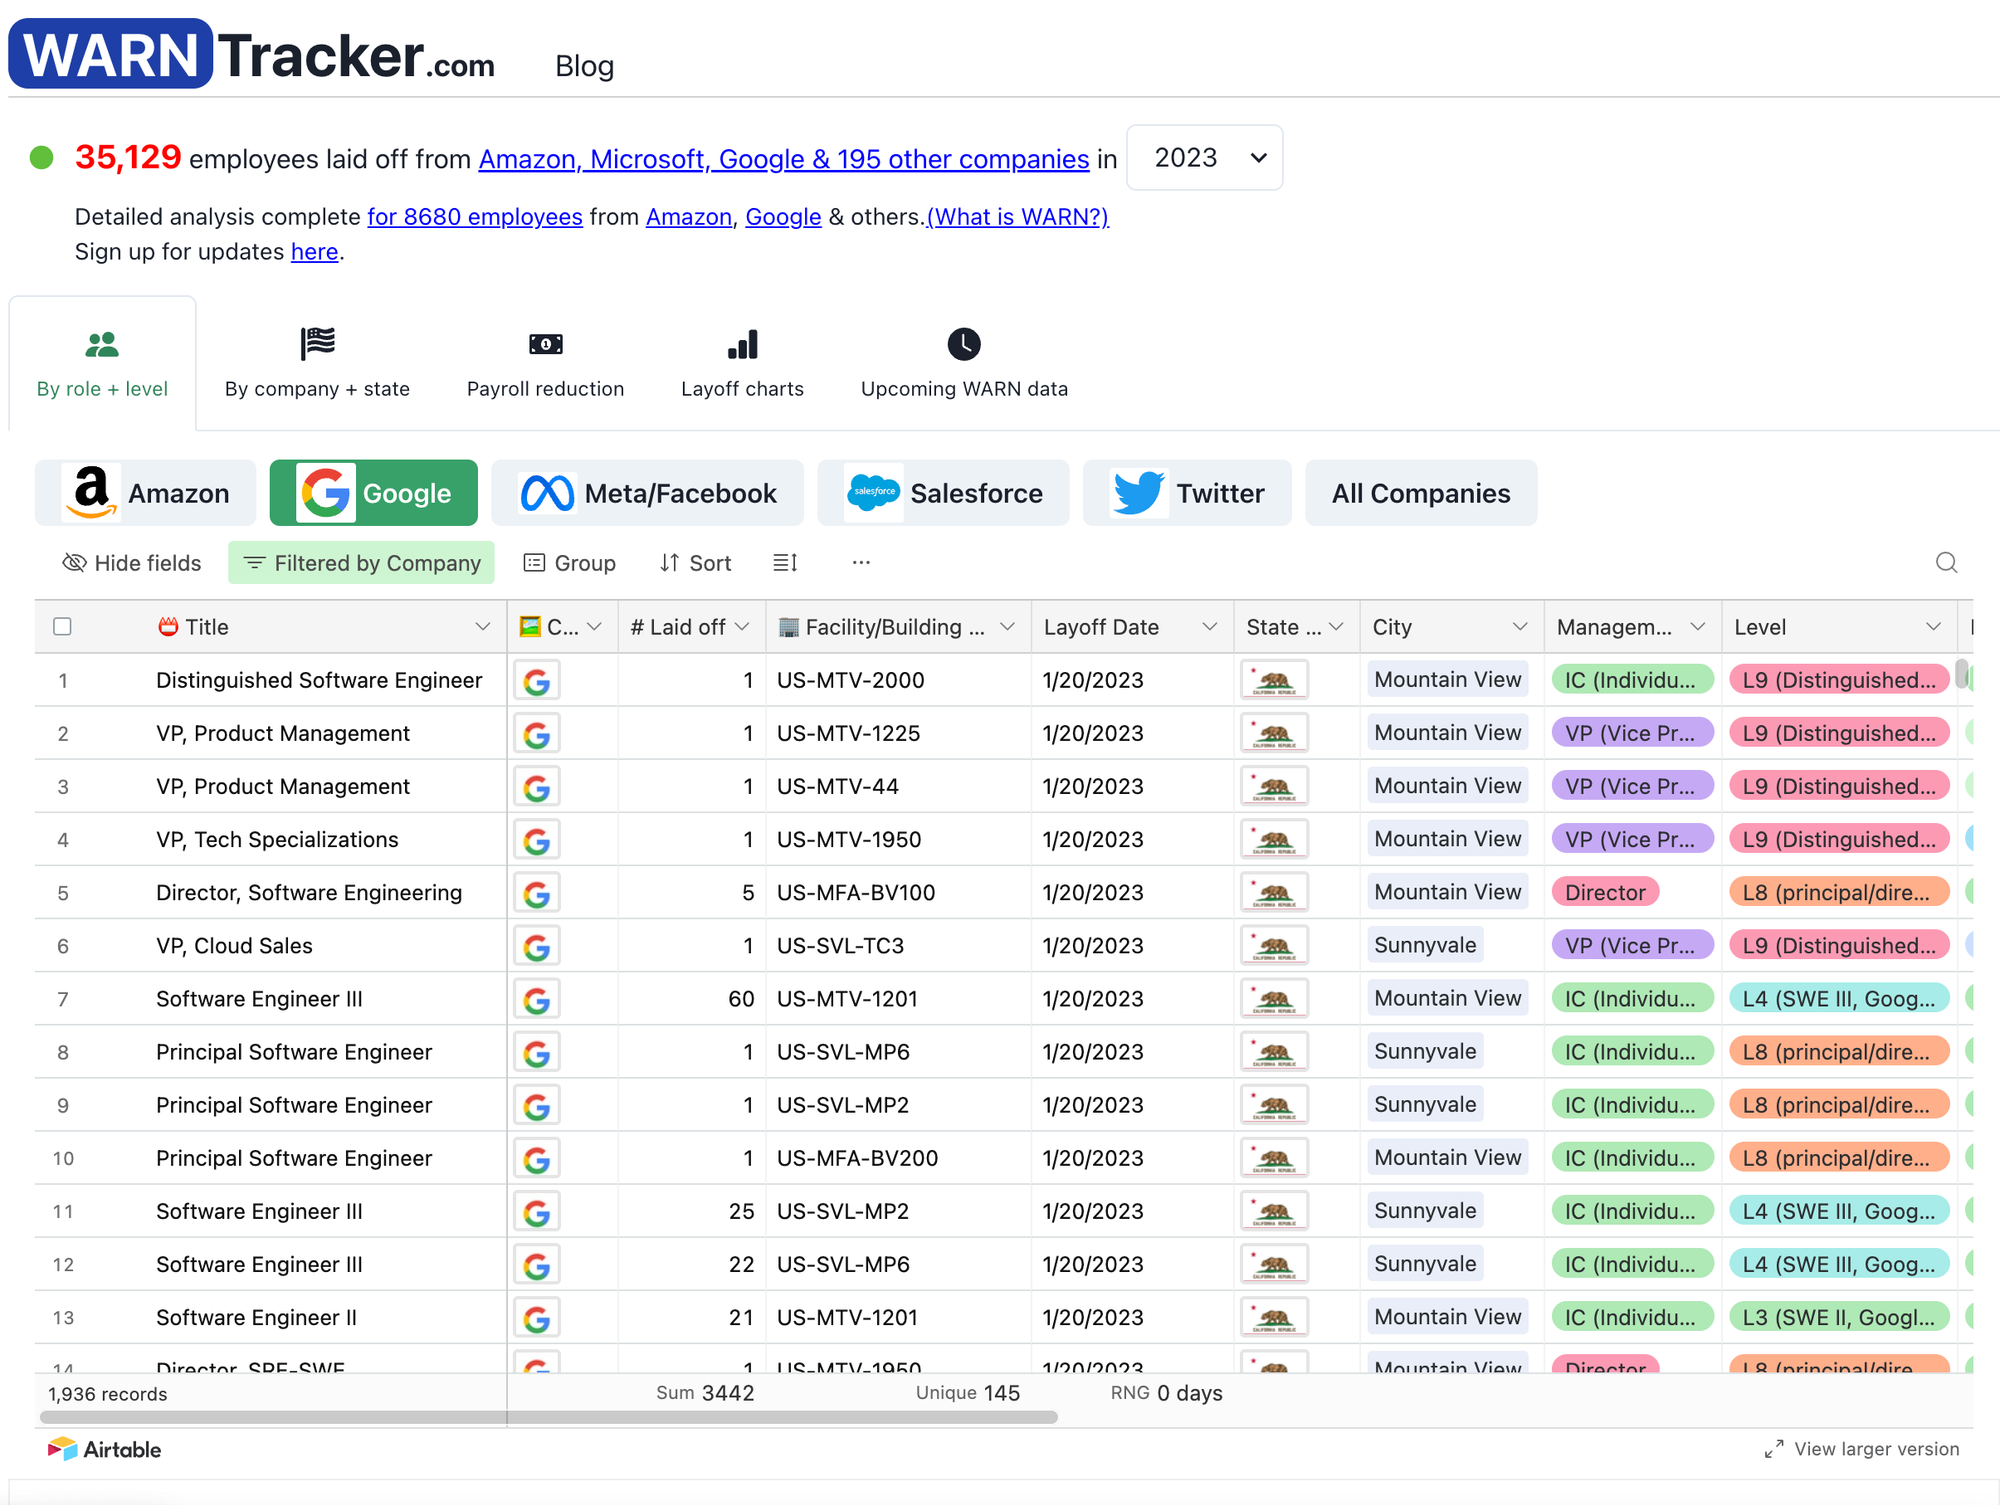
If you would like to take an in-depth look at the data yourself, check out our home page. From there, you can filter by company to do your own analysis.

Caveats
Caveat 1: We are not normalizing the layoff figures with the total population sizes of ICs and managers at these companies.
Ideally, we would be able to compare the total number of managers and ICs at each of these companies in order to determine whether they layoff distribution is biased. So far, we have been unable to find an up-to-date and trustworthy source for this information
Caveat 2: Google’s WARN notices may be reporting some folks as individual contributors, even though they have direct reports
Google allows L5+ engineers to operate as TLs — a sort of hybrid engineer/manager role. While these folks would be reported as non-managers, they would actually have other engineers reporting to them. This would lead to an overcounting of ICs, and an undercounting of managers. This could partially or entirely explain the significantly higher concentration of reported IC layoffs at Google as compared to Meta.
Get the Data
Get access to full data set Purchase historical WARN layoff notice data Purchase data subscription for future WARN layoff notices Purchase company-specific job title breakdown data Request laid-off employee profilesCharts
Layoff charts by state and yearLayoff insights
By company & stateBy role & levelSoftware engineer payroll reductionsTech layoff chartsBlog
Guide to Navigating LayoffsGuide to the WARN ActList of Tech Alumni CommunitiesAll blog postsAbout
For employers - Need help hiring?For job seekersFAQContact usReport possible WARN Act violationJob boards
30,000+ Climate Tech Jobs10,000+ AI / Machine Learning Jobs600+ Telemedicine & Remote Physician JobsTools
EIN & Tax ID Search for US CompaniesPower Plant & Electricity Grid AnalyticsLayoffs by company
Amazon layoffsAramark layoffsBed Bath & Beyond layoffsBoeing layoffsCinemark layoffsGenentech layoffsGeneral Electric layoffsGoogle layoffsHyatt layoffsIntel layoffsJohnson & Johnson layoffsMacy's layoffsMarriott International layoffsMeta/Facebook layoffsMicrosoft layoffsNestle layoffsNetflix layoffsPfizer layoffsSalesforce layoffsTesla layoffsThermo Fisher layoffsTwitter layoffsUnited Airlines layoffsWalmart layoffsOther companiesLayoffs by year
Layoffs in 2025Layoffs in 2024Layoffs in 2023Layoffs in 2022Layoffs in 2021Layoffs in 2020Layoffs in 2019Layoffs in 2018Layoffs in 2017Layoffs in 2016Layoffs in 2015Layoffs in 2014Layoffs in 2013Layoffs in 2012Layoffs in 2011Layoffs in 2010Layoffs in 2009Layoffs in 2008Layoffs in 2007Layoffs in 2006Layoffs in 2005Layoffs in 2004Layoffs in 2003Layoffs in 2002Layoffs in 2001Layoffs in 2000Layoffs in 1999Layoffs in 1998Layoffs in 1997Layoffs in 1996Layoffs in 1995Layoffs in 1994Layoffs in 1993Layoffs in 1992Layoffs in 1991Layoffs in 1990Layoffs in 1989Layoffs in 1988Layoffs by state
CaliforniaNew YorkAlaskaAlabamaArizonaColoradoConnecticutD.C.DelawareFloridaGeorgiaHawaiiIowaIdahoIllinoisIndianaKansasKentuckyLouisianaMassachusettsMarylandMaineMichiganMissouriMontanaNebraskaNew JerseyNew MexicoOhioOklahomaOregonPennsylvaniaRhode IslandSouth CarolinaSouth DakotaTennesseeTexasUtahVirginiaVermontWashingtonWisconsin
© 2025 WARNTracker. All rights reserved.
Some logos provided by Clearbit.Get Data Subscription